Dashboards
The Dashboards provide a visual display of the data scanned by Prowler SaaS and give total visibility into an environment's AWS security posture to enable users to quickly identify trends and make knowledgeable decisions regarding the environment.
Note
It takes several minutes for Prowler SaaS to complete the first scan and update information in the dashboards.
Prowler SaaS contains several dashboards to visually represent the security assessment's results:
Each panel present in the Dashboards is actionable, which means that you will be redirected to the Findings page to see the details of the findings present in the panel.
Overview
The Overview dashboard is the home of Prowler SaaS, automatically displayed when a user logs into the application and shows an overview of the account's security status based on Prowler checks.
At the top of the dashboard, users can configure filters via dynamic variables to choose the data they want displayed. This dashboard allows you to filter by Date, Account, AWS Region and the option to Include Muted Findings:
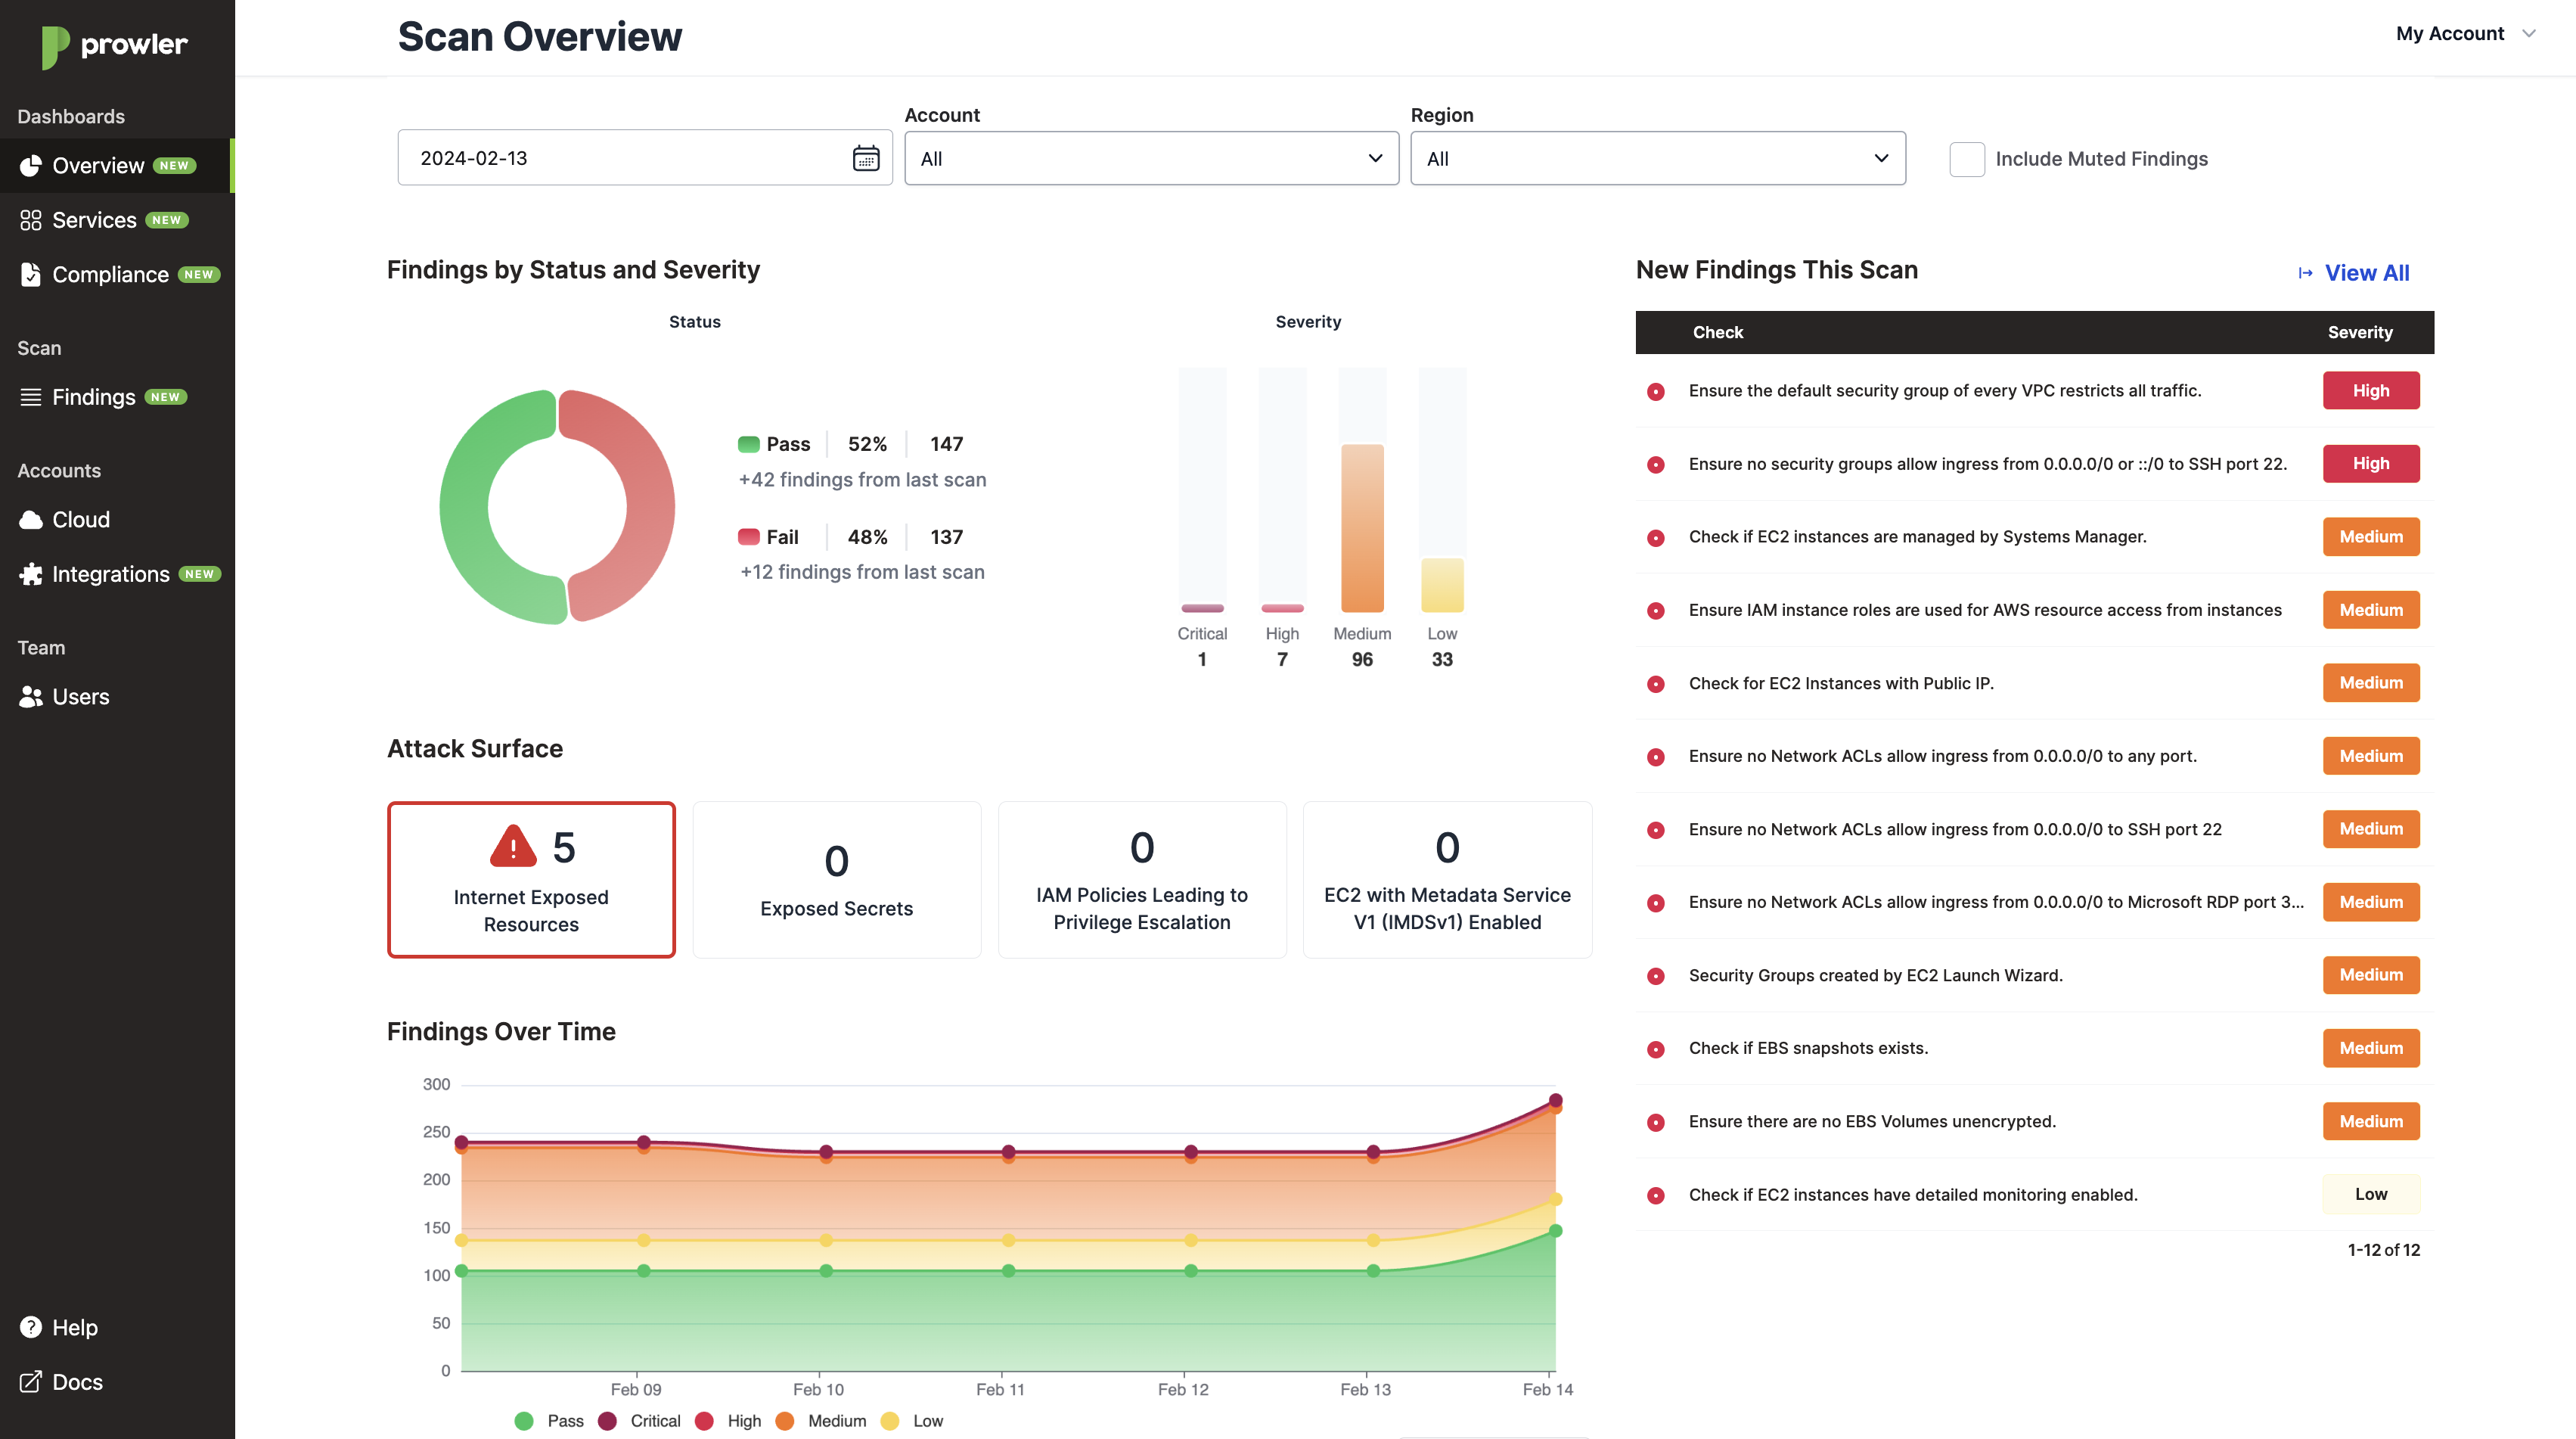
The Overview dashboard contains the following panels:
- Findings by Status and Severity, shows a visualization based on the finding's status and severity.
- New Findings This Scan, shows the new findings present in the scan.
- Attack Surface, shows the security posture based on the following attack vectors:
- Internet Exposed resources
- Exposed Secrets
- Custom Managed IAM Policies that may lead into Privilege Escalation
- EC2 Instances with Metadata Service Version 1 (IMDSv1) enabled
- Findings Over Time, shows the evolution of passed and failed findings by severity, with the ability to show the las 7 or 30 days.
- Findings by Region, shows a map with the number of failed findings by severity in each region. New findings are shown in the map with a blinking red dot.
- Failed Findings by Account (Top 10), shows the top 10 accounts by the number of total failed findings.
- Failed Findings by Service (Top 10), shows the top 10 services by the number of total failed findings.
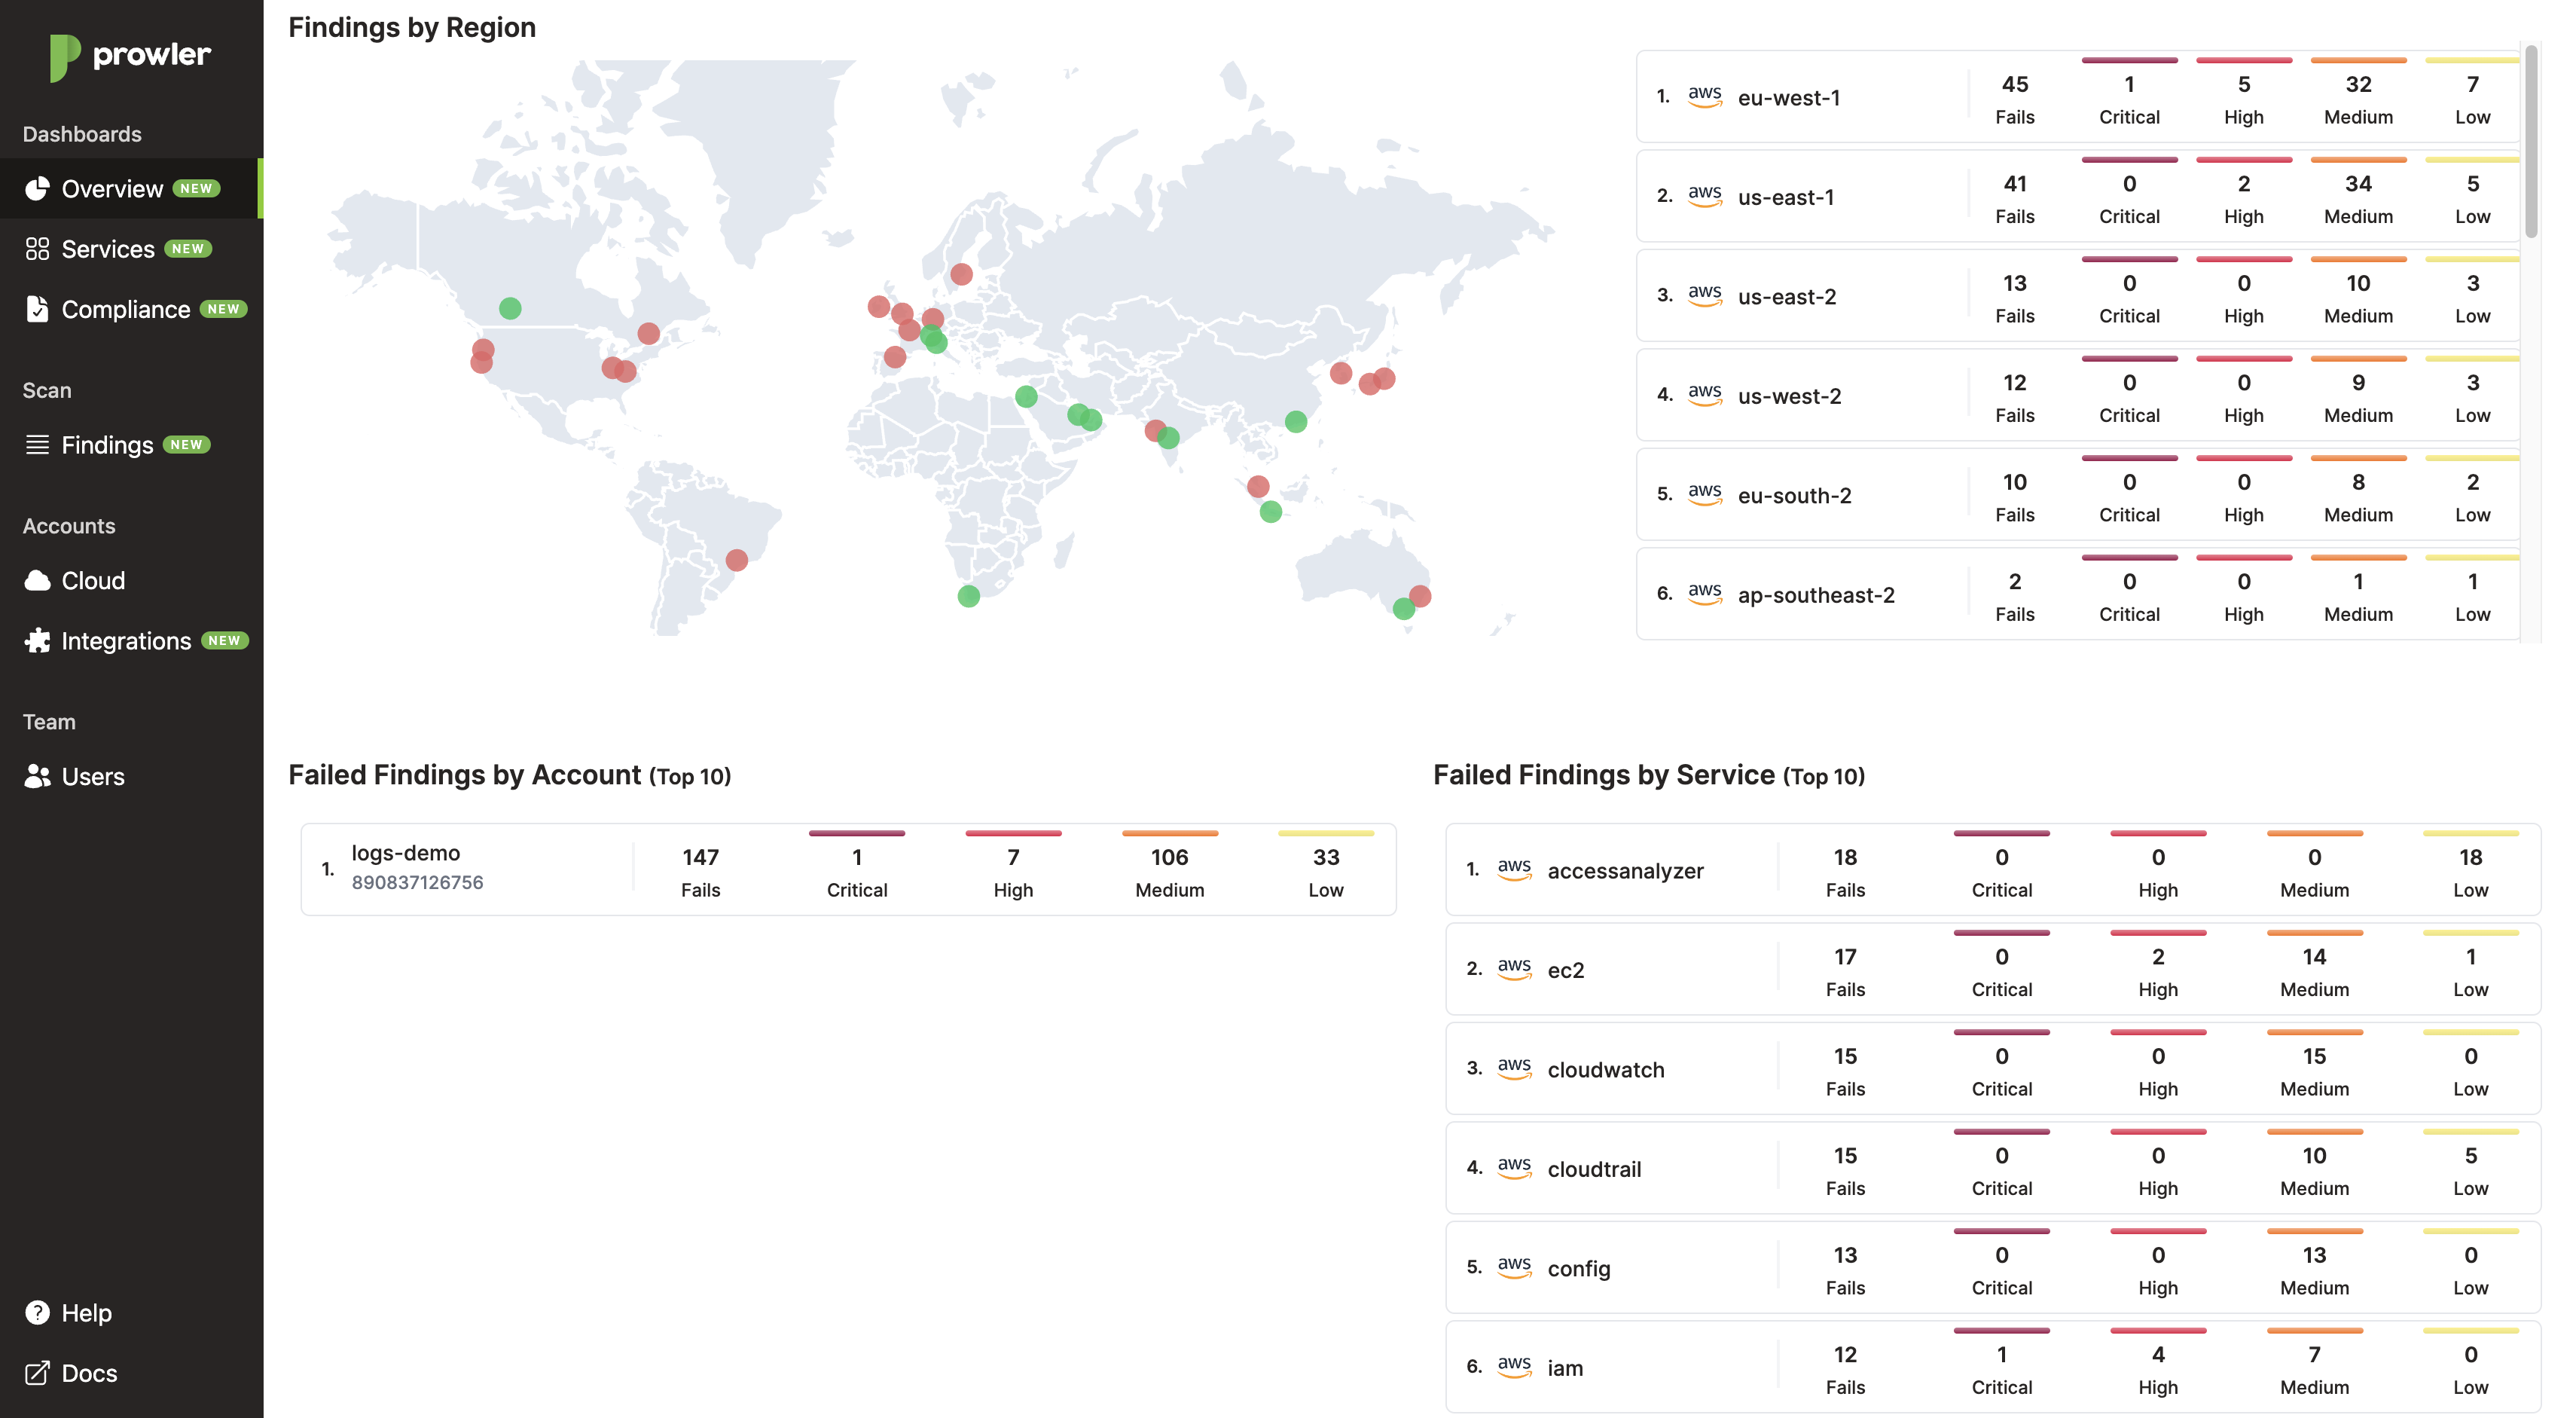
You can click on each panel element to see the details of the findings in the Findings view.
Services
The Services dashboard shows the security status per AWS service that Prowler SaaS scans. No color indicates that all checks were passed in that service, and red indicates one or more checks in that service failed.
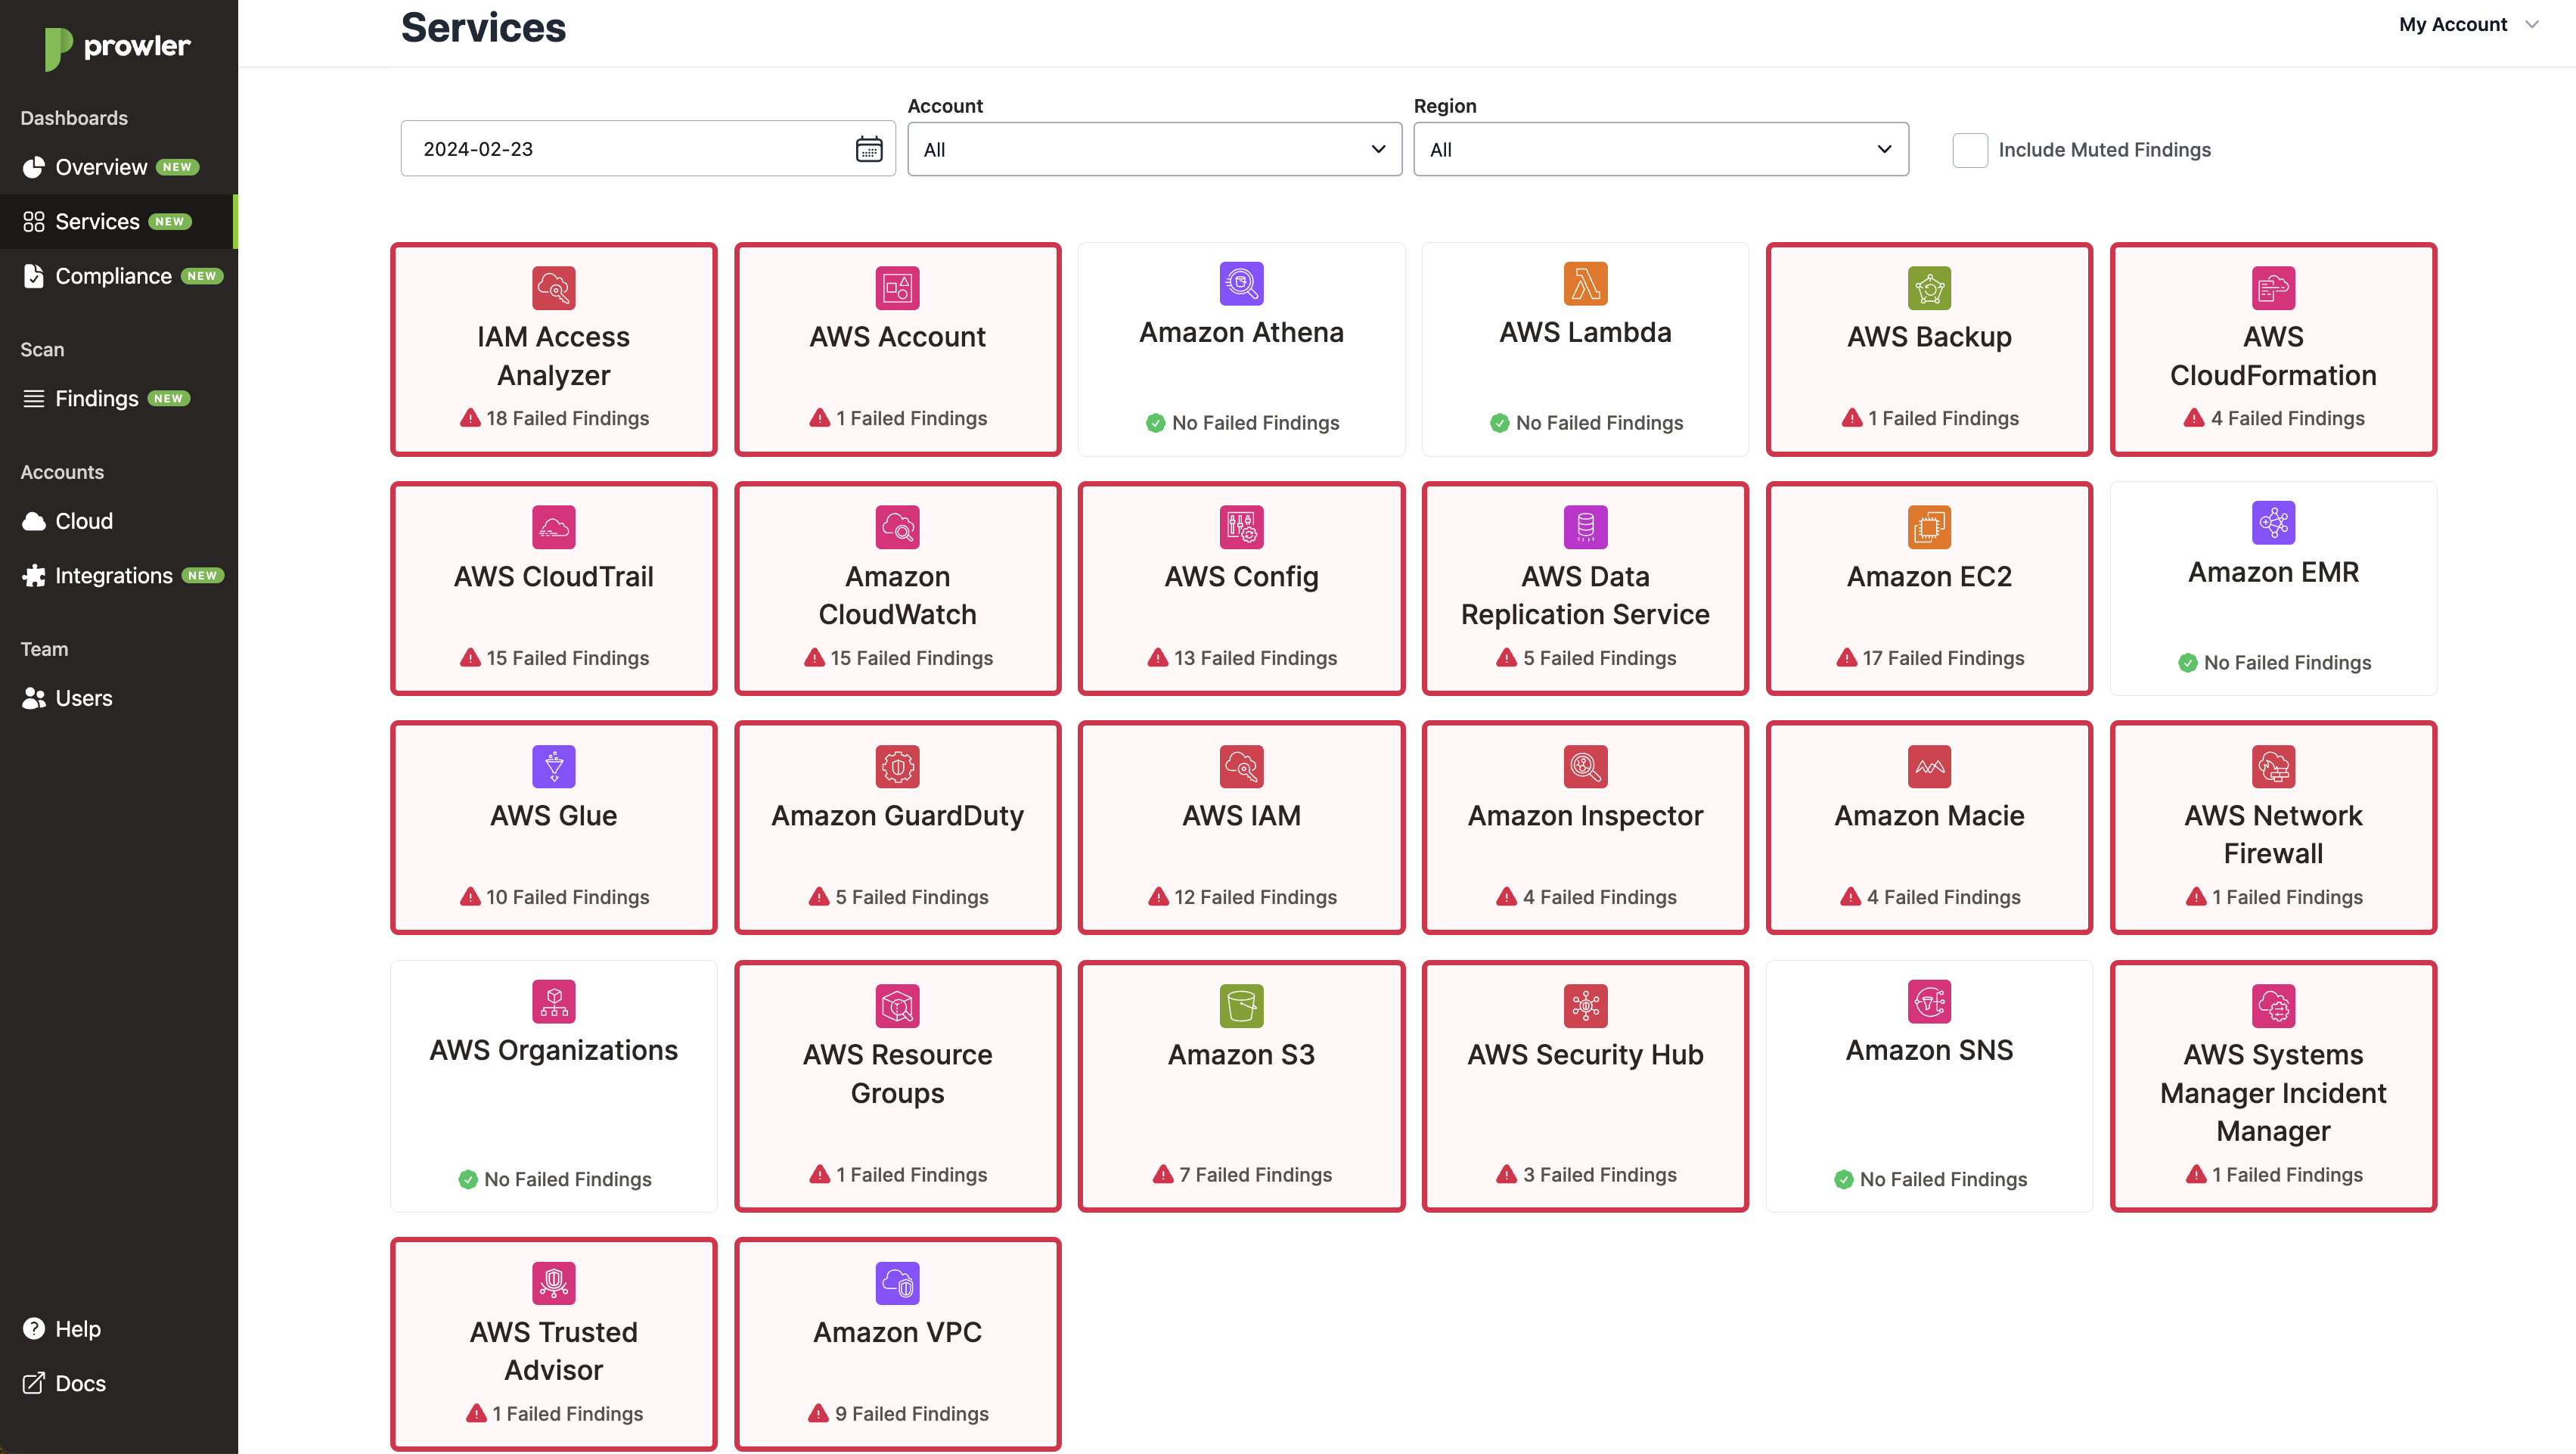
You can click on each service card to see the details of the findings in the Findings view.
Compliance
The Compliance dashboard shows the security status per Compliance Framework mapped in Prowler SaaS. It presents the results grouping them by Compliance Frameworks and Requirements, such as:
- GDPR
- PCI-DSS
- CIS 3.0
- ISO27001 2013
- ENS RD2022 Categoría Alta
- SOC2
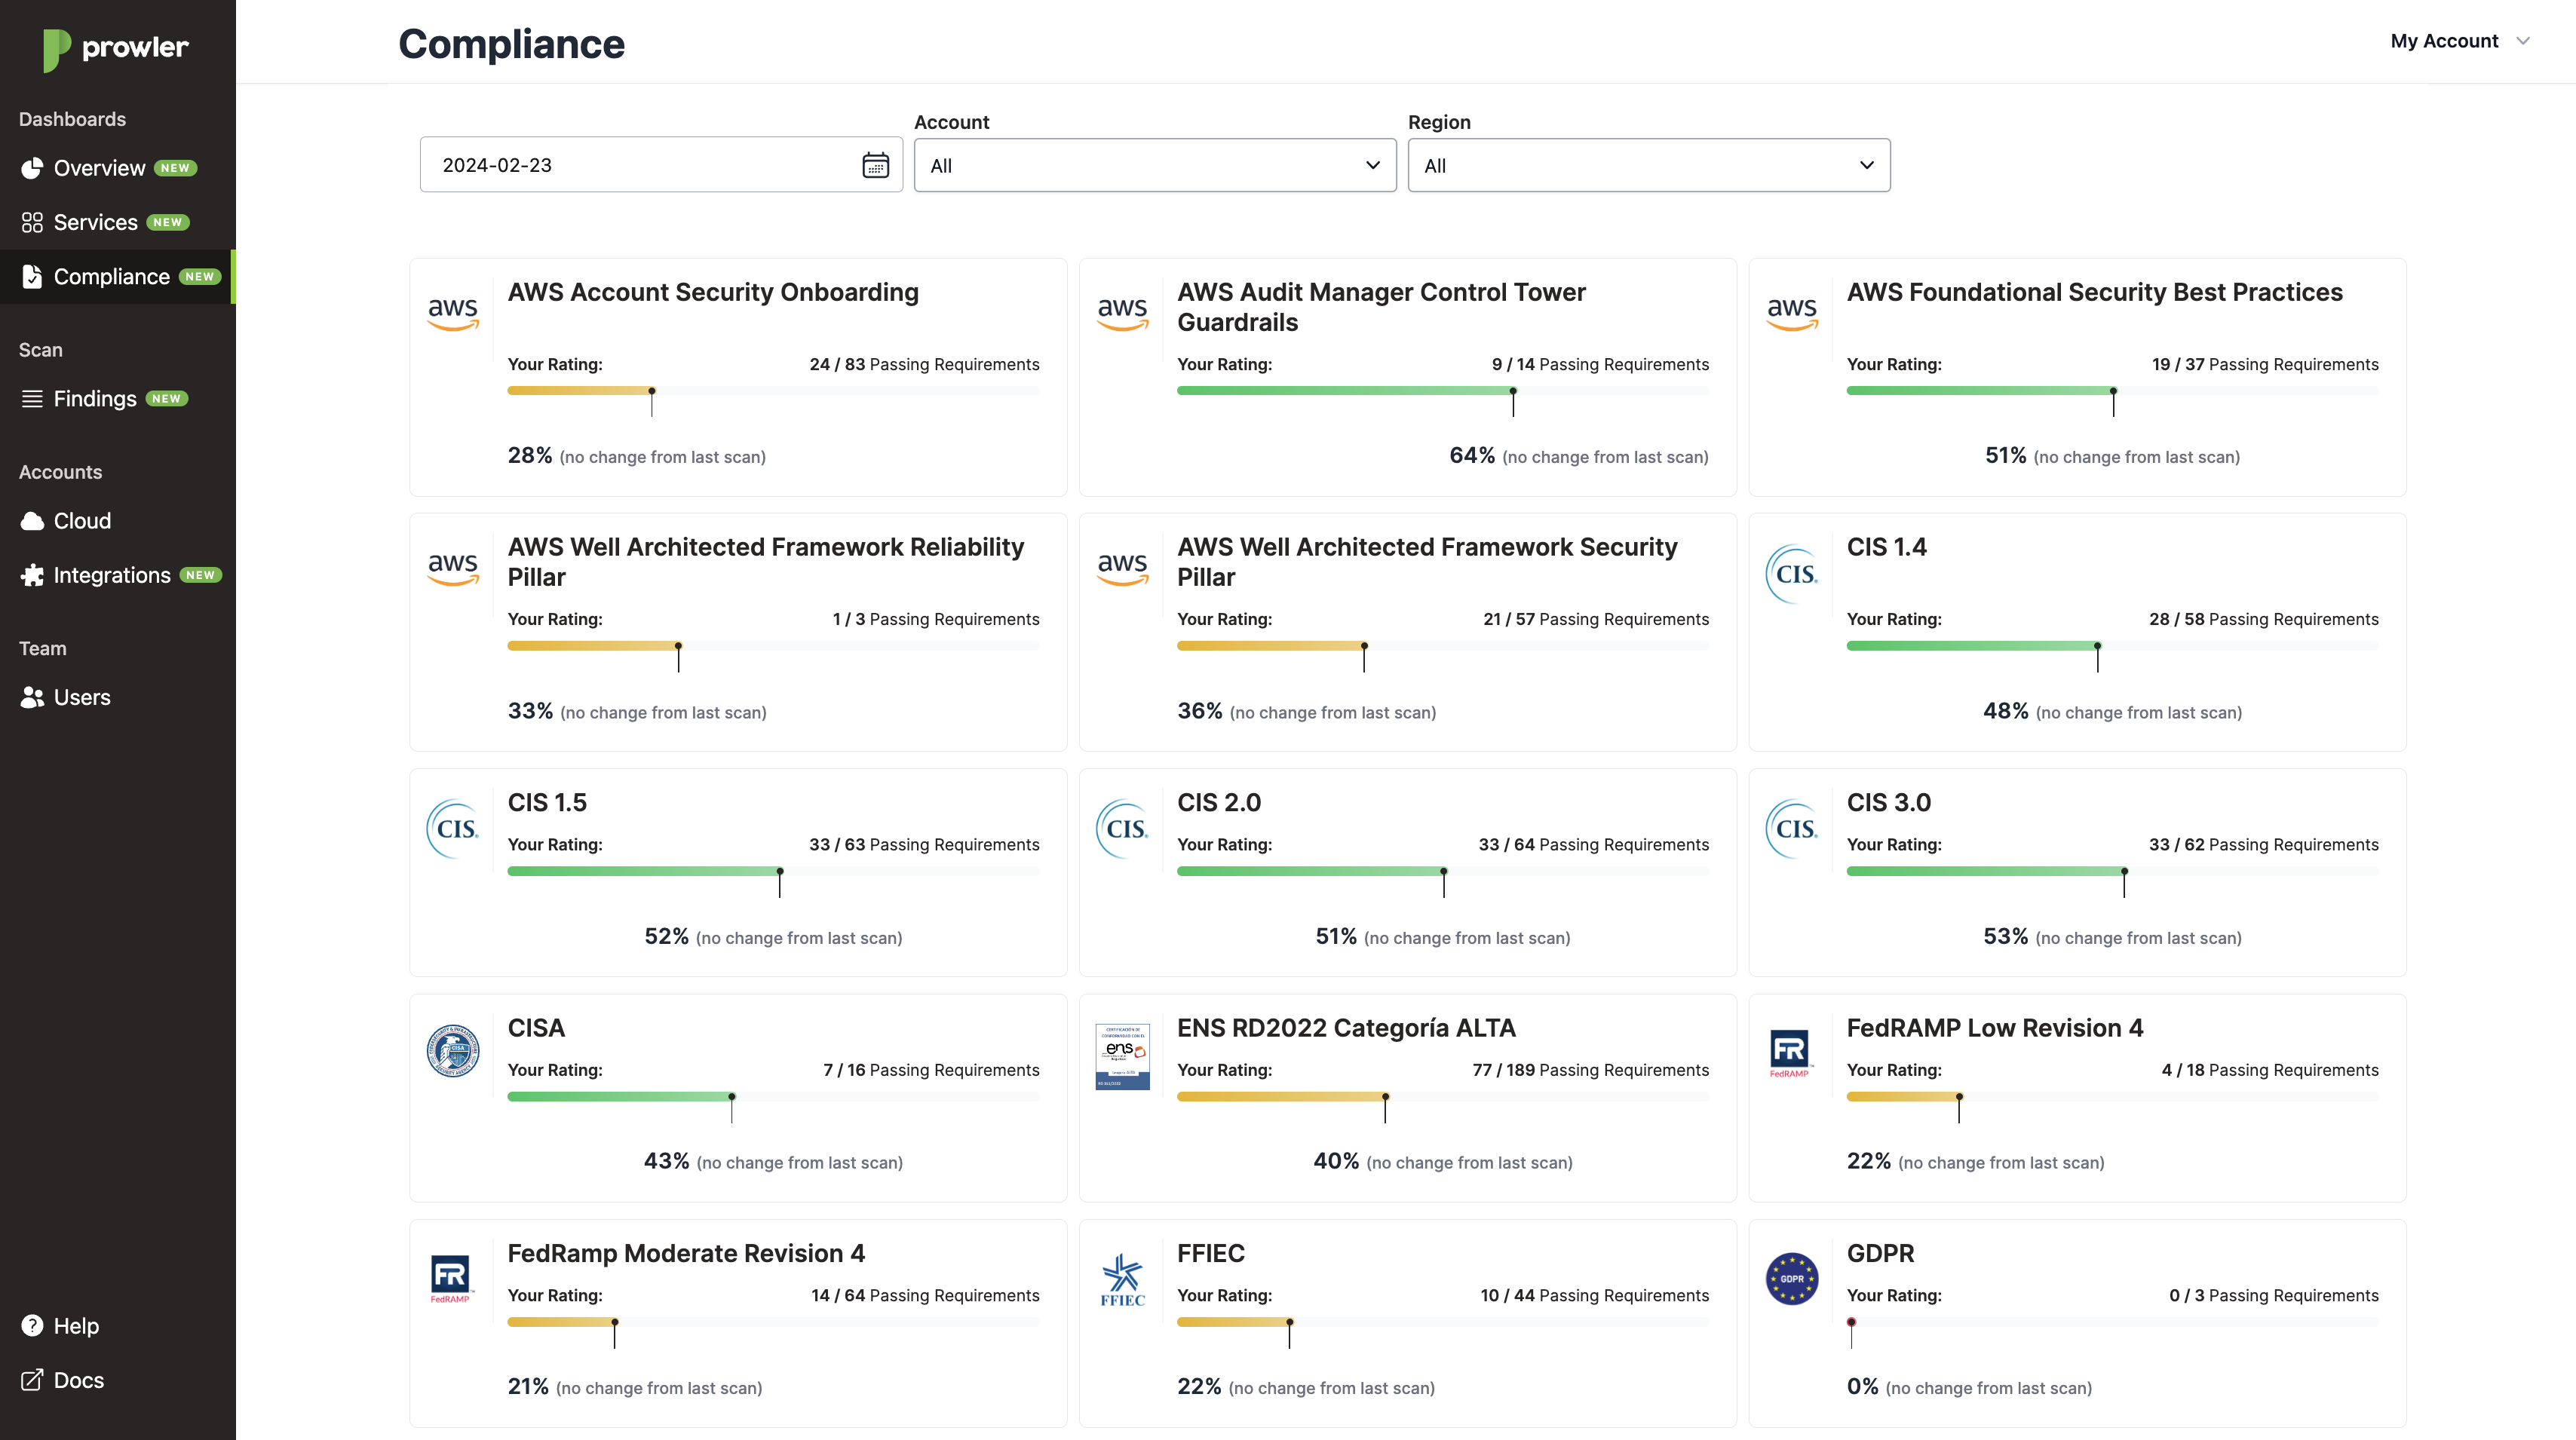
You can click on each compliance card to see the details of the findings in the Findings view.
Findings
The Findings view shows detailed information for all of the findings generated by Prowler SaaS.
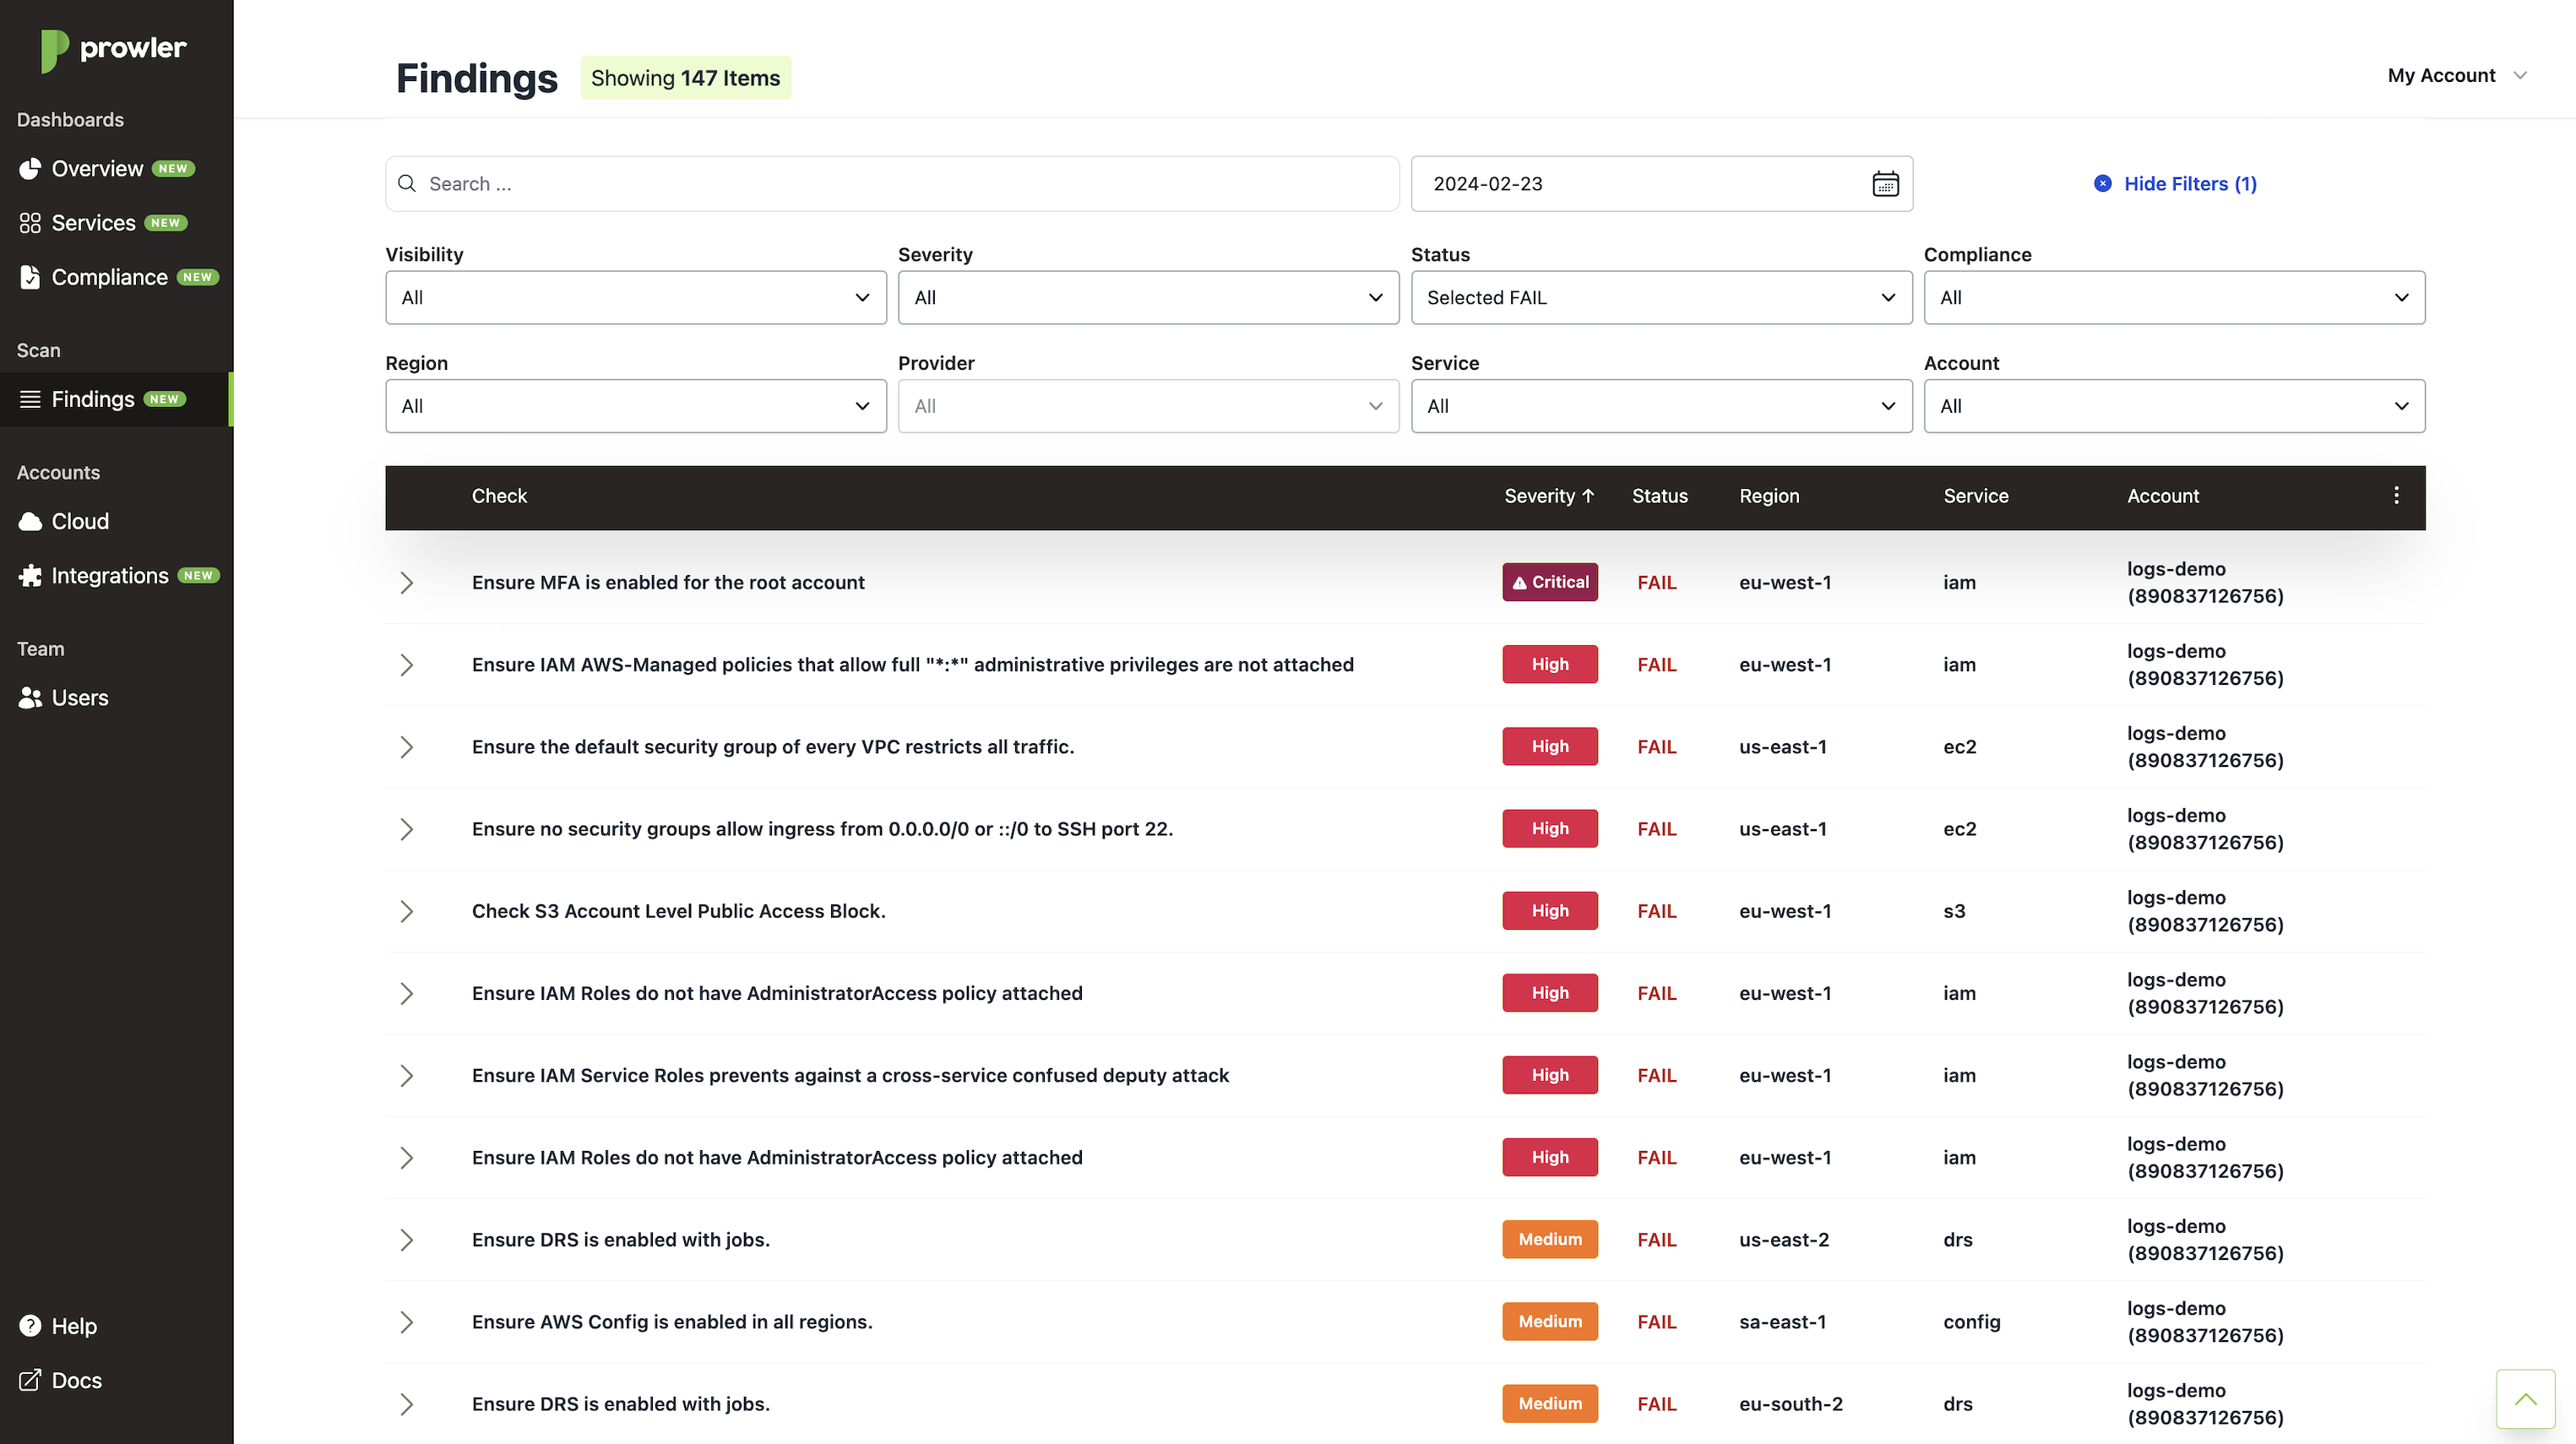
The Findings view can be filtered using the filters in the top bar for:
- Visibility: To select
neworchangedfindings based on their status. - Severity: To select
Critical,High,MediumorLowfindings. - Status: For
FAIL,PASSorMUTEDfindings. - Compliance: To select the Compliance Framework findings.
- Region: To select findings based on their AWS region.
- Service: To select findings based on their AWS service.
- Account: To select findings based on their AWS account.
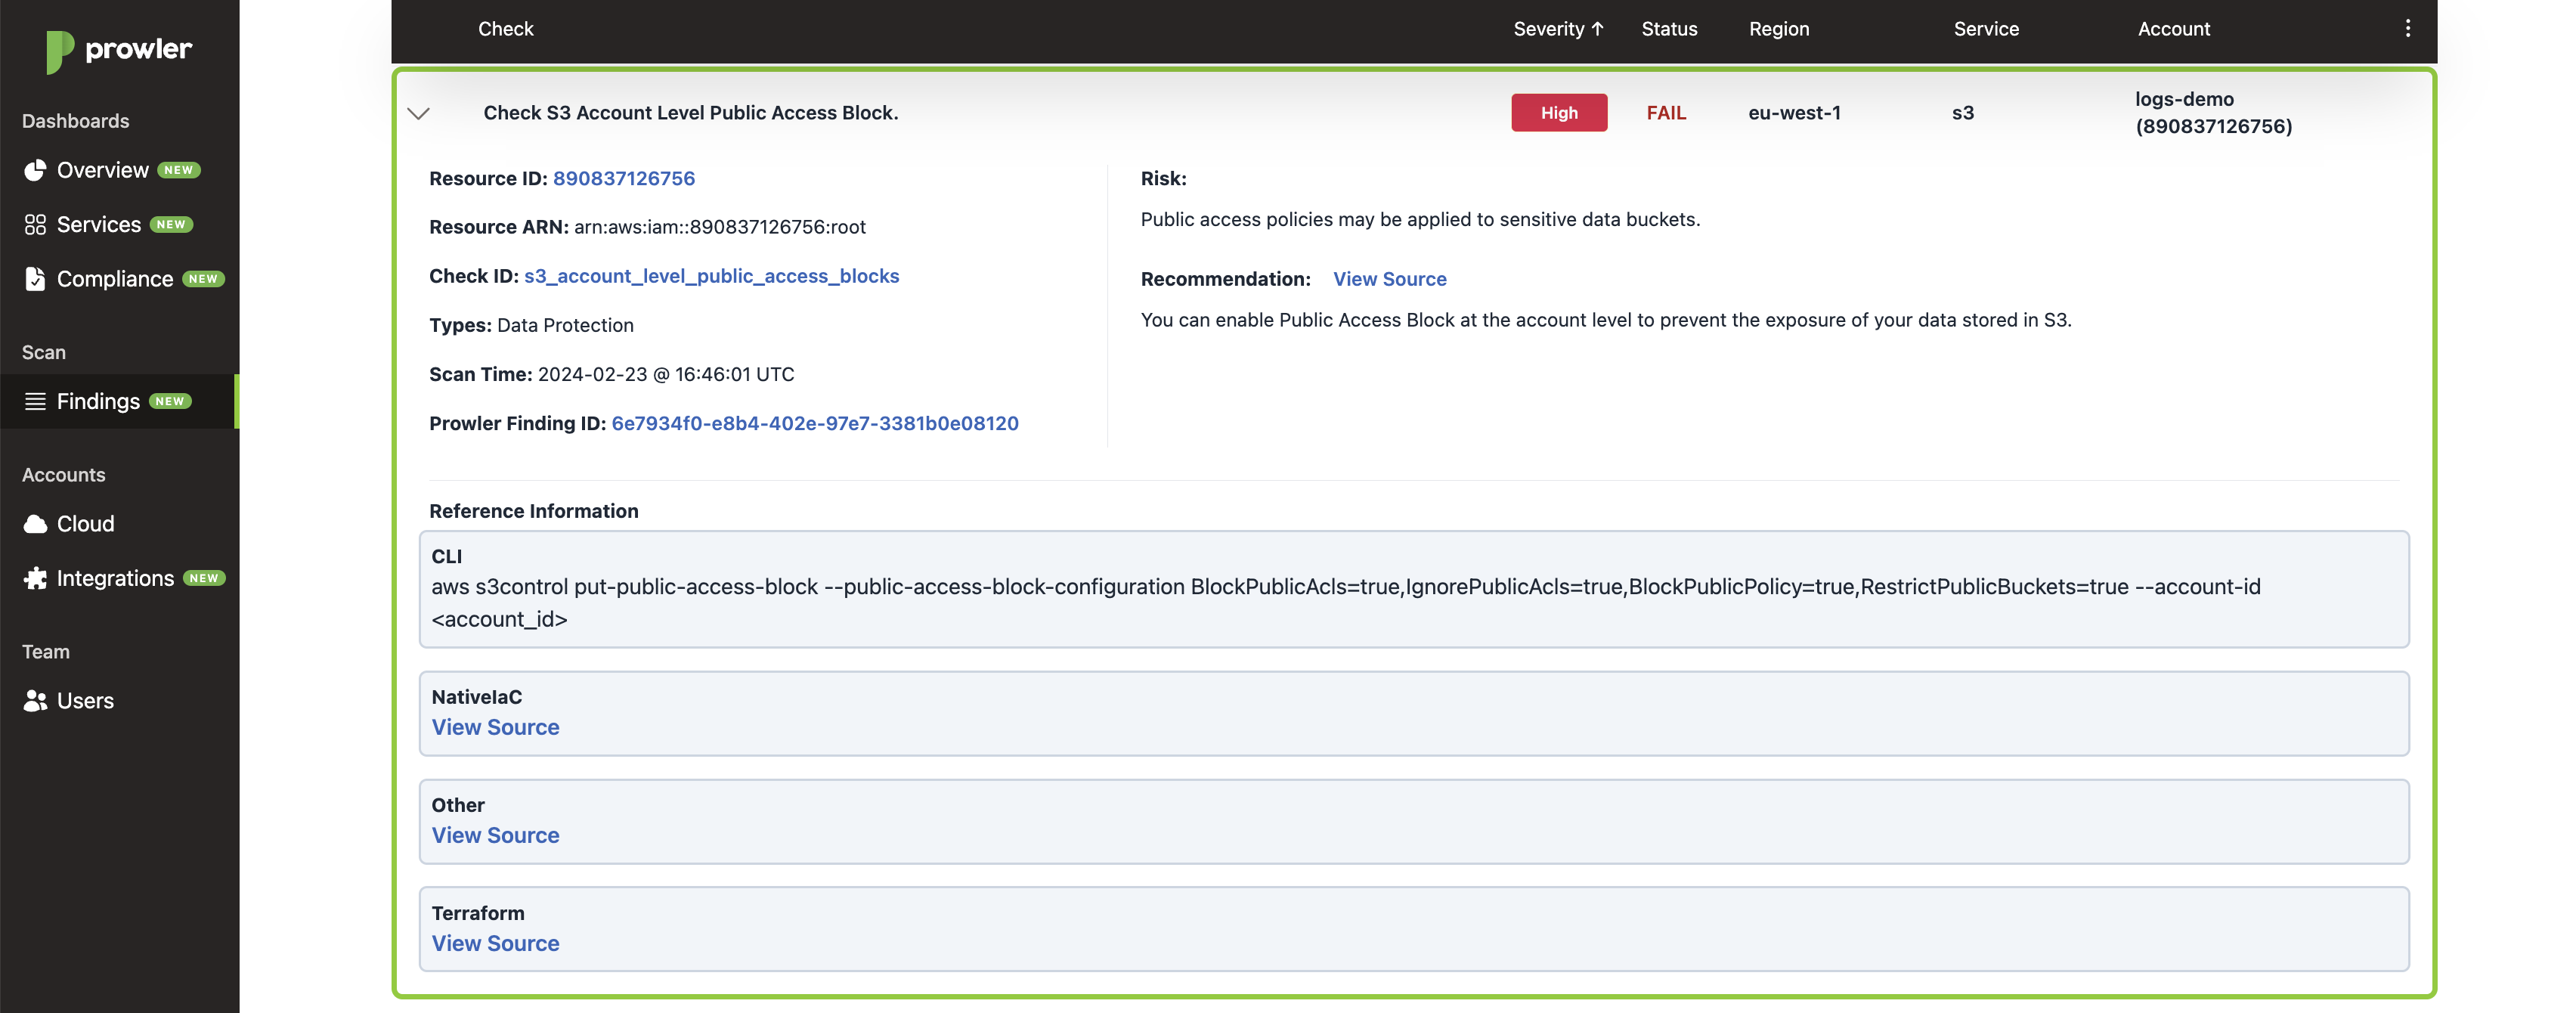
Each finding has a view where you can see all the details including the affected resource, how you can remediate the finding, the check's recommendation, scan time, possible risks, among many others:
The Findings view also allows you to configure and view the Mute Findings. Please go the Mute Findings page for more details.